DEBUGGING TOOLS IN LINUX
Debugging Tools in Linux are those programs that allows us to monitor, control, and correct other program’s error while they execute.
Some of the Debugging Tools are as -
1.Querying (/proc, /sys etc)
2.tcpdump
1) Querying (/proc, /sys etc)
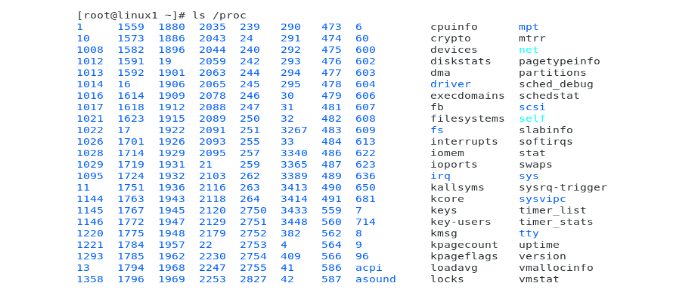
If we want to know which process occupies how much RAM memory in our system and what is the process state in the kernel. The proc file system gives you runtime system information.
#ls /proc
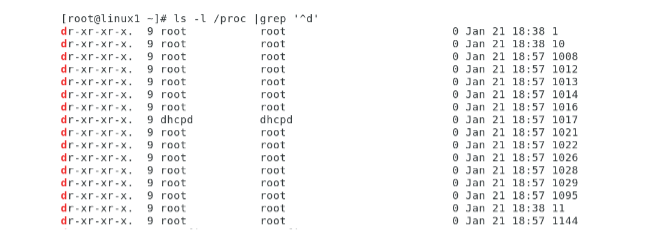
#ls –l /proc
If we list the directories, you will find that for each PID of a process, there is a dedicated directory. You can check directories only on the terminal using.
#ls -l /proc | grep '^d'
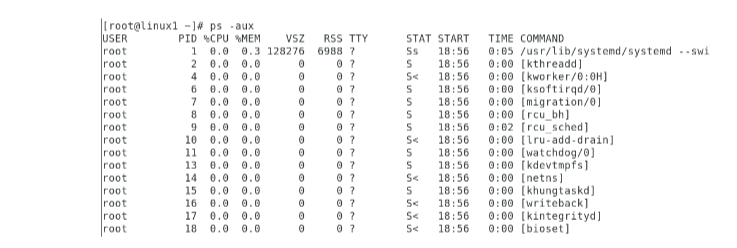
To view the information of a specific process assigned a PID we can use following command.
#ps -aux
Example:
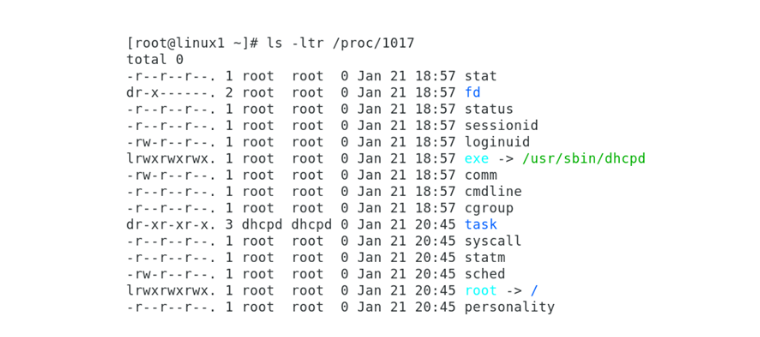
To check the information about specific process with PID 1017, we can use the following command.
#ls -ltr /proc/1017
To view the status of the process with PID 1017, we can use the following command-
#ls -ltr /proc/1017/status

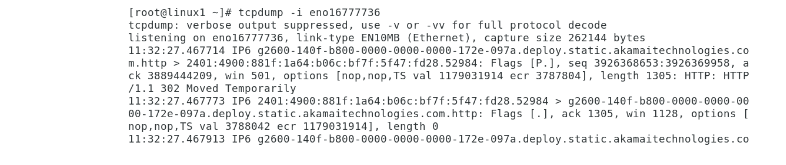
2) tcpdump
Network administrators use tcpdump to analyze traffic in Linux systems. Learn how to install and use tcpdump, as well as examine the results of captured traffic.
The tcpdump utility runs on the Linux command line. Tcpdump is a simple application that works well in Linux servers without Linux-based network devices, a GUI or various IoT nodes. These attributes give tcpdump an advantage over more powerful GUI-based analyzers, like Wireshark. Tcpdump is also scriptable, which means it can enable scheduled captures.
Install tcpdump
#yum remove tcpdump
#yum install tcpdump –y
Tcpdump displays captured packets in real time. This is useful if you know what to look for and if there's not a lot of traffic on the interface. However, it's much more likely that your screen quickly scrolls with nearly incomprehensible information.
#tcpdump –i [interface name]
Display available interfaces-
#tcpdump –D
Select specific host information-
#tcpdump –i eth0 host 192.168.2.2
This command shows user activity on the server as well as username and password of unsecured services like ftp service are displayed.
If you want traffic that originates only from 192.168.2.2, then type-
#tcpdump -i eth0 src host 192.168.2.2
Filter by port number-
#tcpdump -i eth0 dst port 23
If you want to find insecure web traffic type the following-
#tcpdump -i eth0 dst port 80
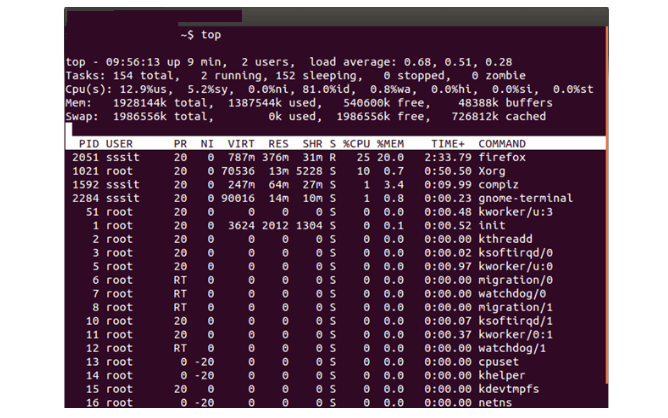
3)Process Analyzers in Linux
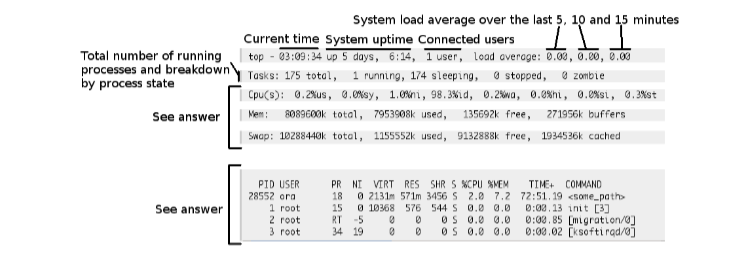
top
The best way to monitor the processes running on your Linux server is to use the top command-
#top
Here are some useful keyboard shortcuts:
- Press ‘1’ to toggle between single and combined CPU view.
- Use ‘f’ to select & display specific fields Ex. Command name, Priority
- Press ‘o’ to set the sort field (Ex. %CPU, %MEM, etc.).
- Use ‘s’ to set the update interval.
- Press ‘H’ to toggle threads visibility (if available).
1.Display Specific Fields:
#top -o %CPU
2. Set Update Interval
#top -d 7
This command sets the update interval to 7 seconds. ‘top’ will refresh the information every 7 seconds.
3. Highlight a Specific User’s Processes
#top -u user1
4. Sort by Memory Usage:
#top -o %MEM